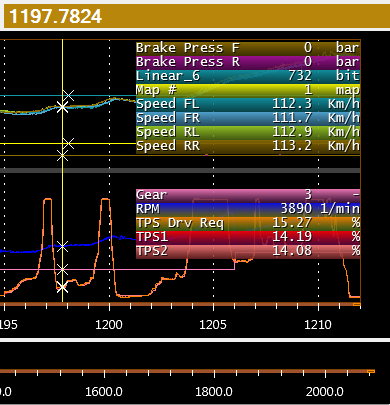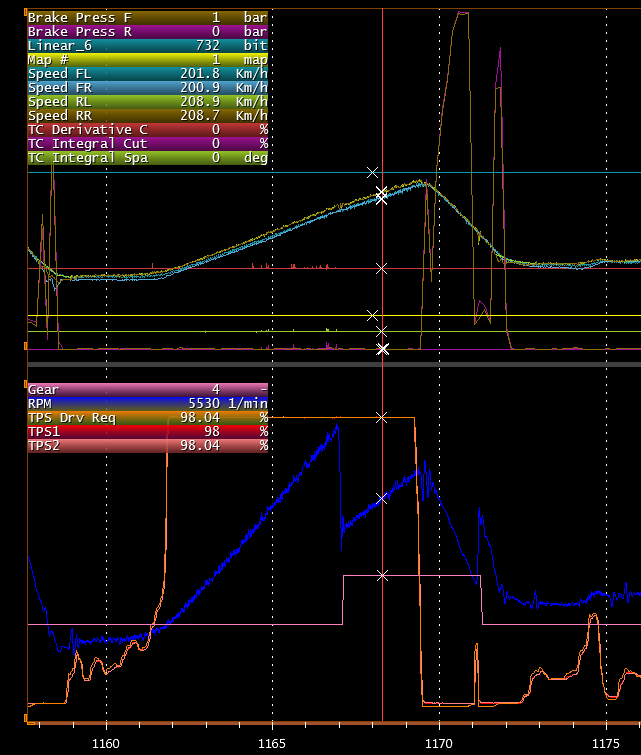
You can place a cursor anywhere in the display window.
Simply double click on the desired position to place the cursor.
You can adjust the width of the cursor by clicking on Cursors, then Cursor line width.
Column V(t1) in the channel list now shows the data the value of individual channels at the cursor position is shown.
The measuring points are marked with an x where the lines are crossing.
You can open a window displaying channel values for all channels displayed in the display window.
Click on Tools in the main menu, and then click on Show the values related to the current cursor on the chart background.
Data will be shown in the upper left hand corner of the data window.
Displaying channel data can also be linked directly to the cursor position, shown in a separate window.
Click on Tools in the main menu, and then click on Show the values related to the current cursor in a balloon.
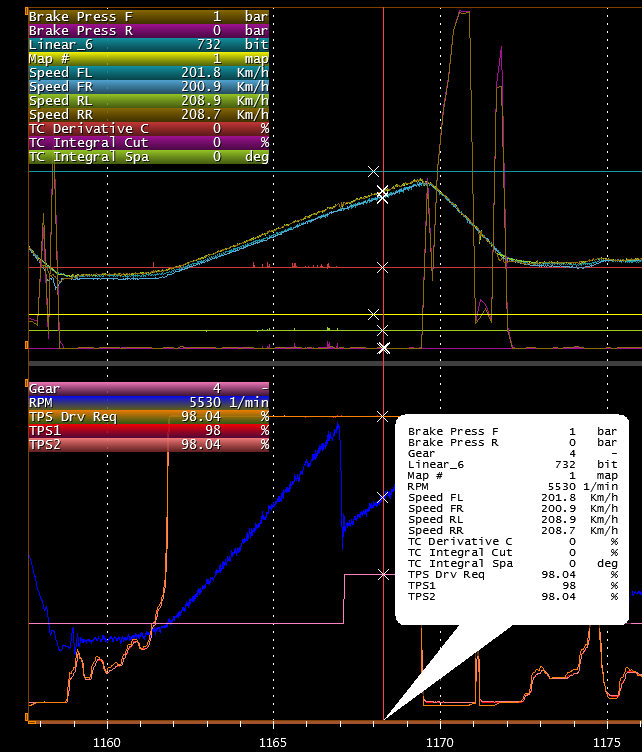
Using your mouse you can grab the cursor and move it to any position. Place your mouse pointer over the cursor, it will change to show arrows, now click and hold the left mouse button while dragging the cursor.
Using the left arrow key (←) and the right hand arrow key (→) you can move the cursor to the nearest sampling point.
Using the scroll wheel on your mouse you can zoom in and zoom out centred around the cursor position.
While dragging the cursor you can monitor the channel values change in window V(t1).
The overview window at the bottom of your monitor will show the full log while the sections above shows any level, zoomed in or zoomed out. The part of the logged data analysed is shown as a green area in the overview window.
-
CTRL+O is a hot key to zoom out to show the complete run.
-
CTRL+P is a hot key for zoom out in steps to finally show the complete run.
-
CTRL+R bring up a 2nd cursor, placing it close to the primary cursor.
Two Cursors
It is possible to load a 2nd cursor. With this feature you can for example measure times between events and it displays mean values of the data channels between the two cursors.

Click CTRL+R to add a second cursor on you display.

With 2 cursors in a display you can measure time between events and you can quickly evaluate data channel values between the two cursors:
Additional columns are now displayed in the channel list:
-
D (C1,C2) shows the difference between channel values at cursor 1 and cursor 2 positions.
-
Av (C1,C2) shows the average channel value between cursor 1 and cursor 2 positions.
-
Max (C1,C2) shows the maximum channel value found between cursor 1 and cursor 2 positions.
-
V(t2) shows the channel data at cursor 2 position.
The time measured since start recording data and to the position of cursor 1 is shown in the left window above the graphic display.
The time measured since start recording data and to the position of cursor 2 is shown in the right window above the graphic display.
The time difference between the positions of cursor 1 and cursor 2 are shown in the middle window above the graphic display.
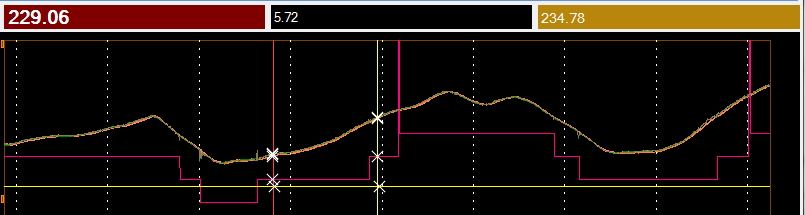
By clicking on either of these windows you can change which cursor is the active one.
If you have activated the display of channel data values the data for cursor 1 position will be shown on the left side of the display when you move the cursor.
The data for cursor 2 position will be shown on the right side of the display when you move the cursor.