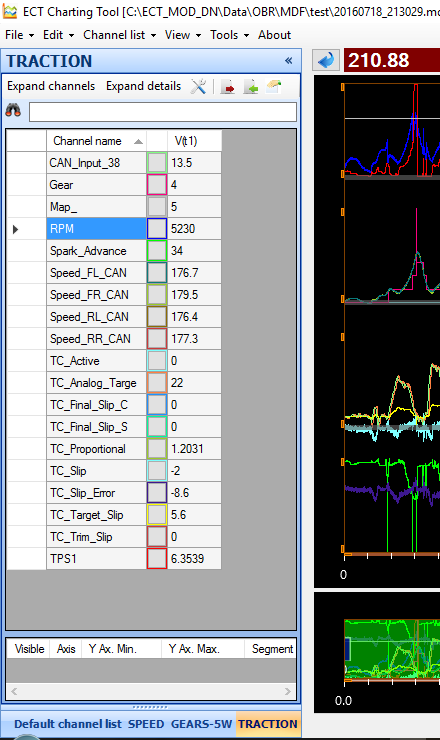
To the left of the strip chart graphic data window you have the channel list. This list displays either all channels loaded with the data file if you click “Expand channels” or, if you click “Compact channels” only the channels set as visible in the data window.

-
Click Channel Name to sort channels alphabetically.
-
Tick or untick the box marked Visible to add or remove channels.
-
Tick or untick the box marked Axis to add or remove the channel scaling on the Y-axis.
-
Y Ax. Min. shows the display’s minimum value of the particular channel.
-
Min Value shows the data channels global minimum value.
-
V(t) shows the channel data at the cursor position.
-
Max Value shows the data channels global maximum value.
-
Y Ax. Max. shows the display’s maximum value of the particular channel.
-
Unit shows the unit of the data channel, for example bar, degrees, RPM.
-
Using Segments you can assign the data channel to 1 of 5 available display segments.
-
In Line width you select the thickness of the data graph, recommended value is “1”.
Hoover the mouse over any channel listed in the channel list to highlight the channel in the graphic window.
You can also hoover the mouse over the data graph in the display window and the channel will be highlighted in the channel list.
-
If you double click on the minimum channel value in the channel list a cursor will be placed in that position within the full run. Using the zoom function you can view the data in detail.
-
If you double click on the maximum channel value in the channel list a cursor will be placed in that position within the full run. Using the zoom function you can view the data in detail.
![]()
Click on the icon
![]()
to define which columns shall be visible in the channel list.
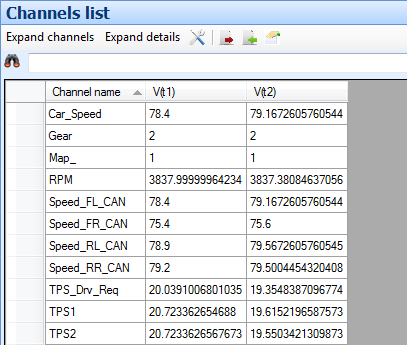
Typical full channel list for a user configured display having 2 cursors.

Click on Compact Details to reduce the column list to display the data channel values at cursor positions only.

A full channel list could look like this:

Click on Compact Channels to show only channels active in the open graphic window.

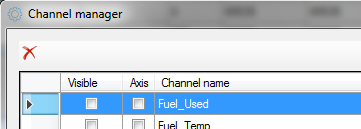
Click on Channels Manager to open a window displaying all channels loaded with the current data file.

If you want to unload a data channel click on the cell to the left of the channel name and then click on the red cross.
You can also use a math function to load a calculated data file.
Select a base file for use with the math function.
Key in a name for the new data channel, select which segment to add it into and also select its colour.
Click in Use selected channel to proceed.
Select the math function, click on D to add a decimal number or click on another file name.
Click Add channel when done.